Data with no context
Location logs, engine diagnostics and event timestamps pile up, but nothing turns them into a trend or a cost driver. The fleet data is there; the answer is not.
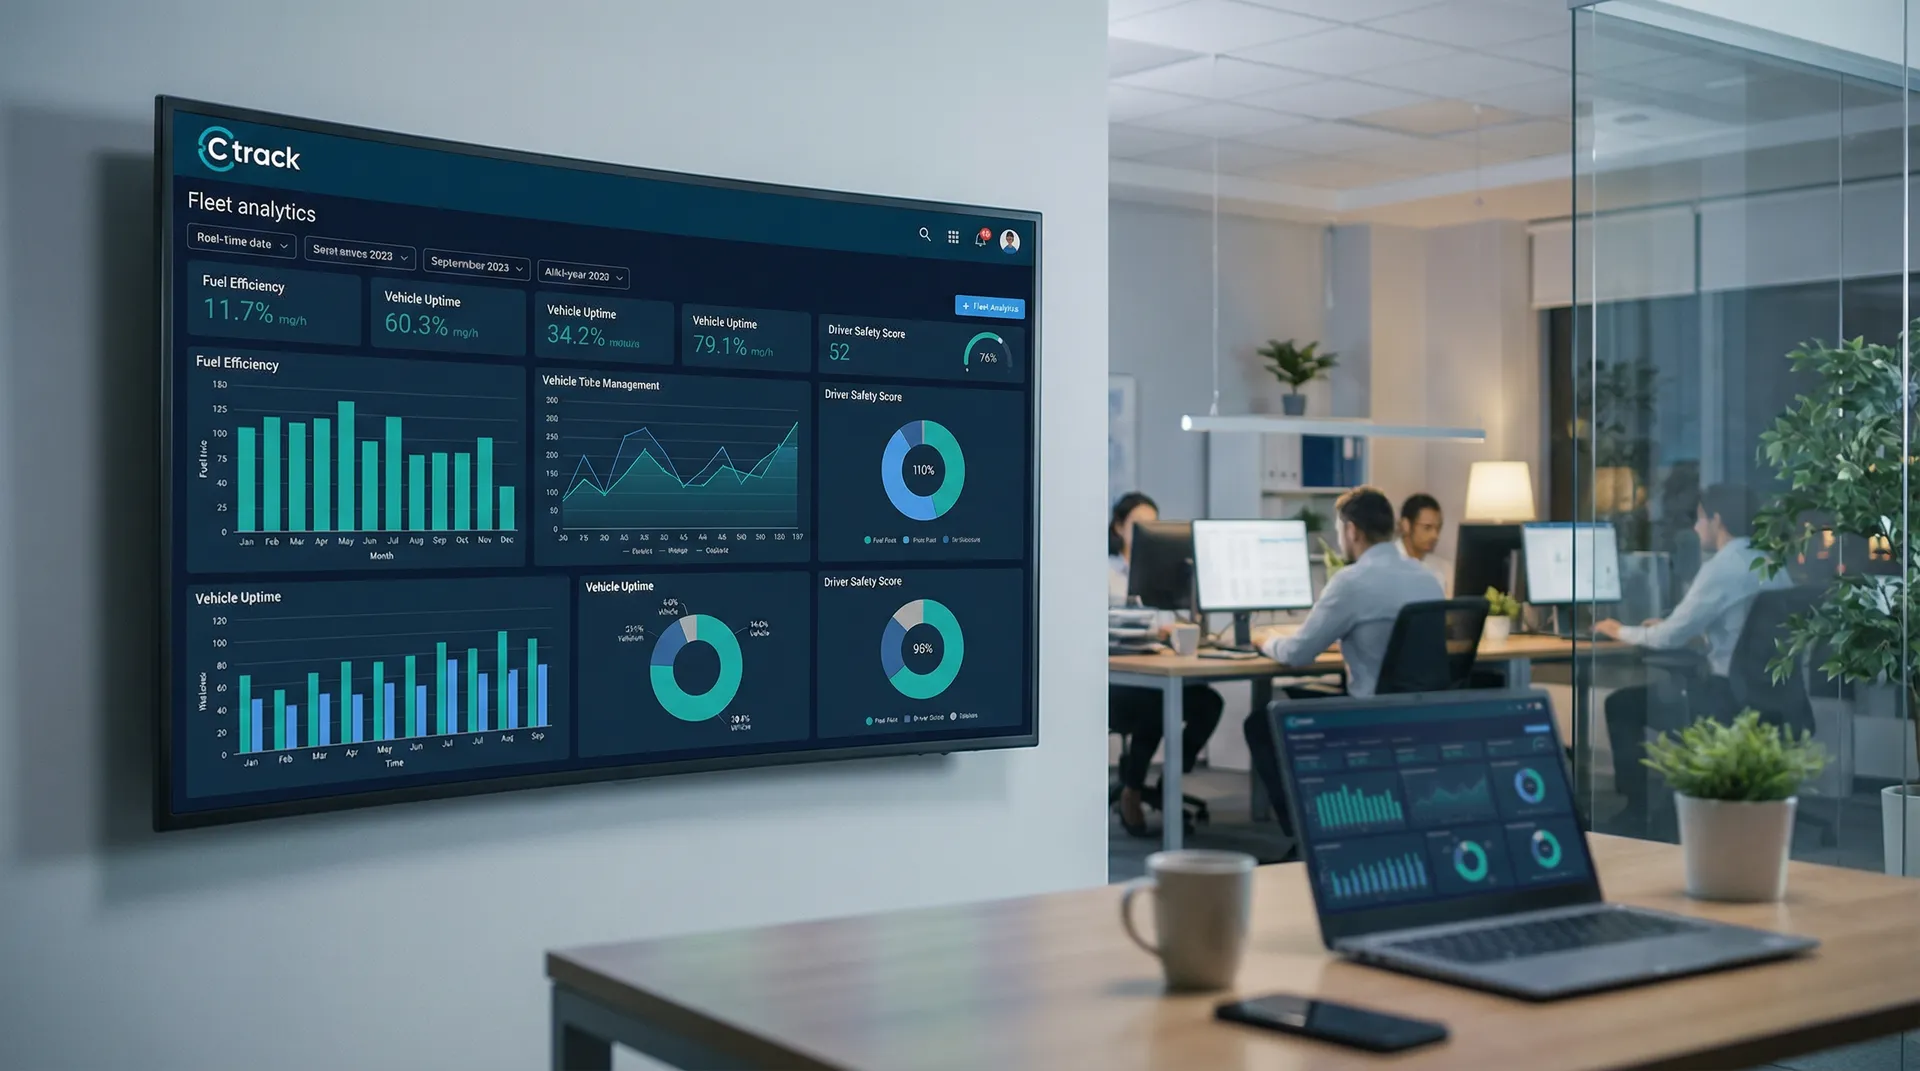
Ctrack fleet analytics turns the telematics your vehicles already generate into board-ready KPIs, scheduled reports and live dashboards on one Crystal platform. Give fleet managers the actionable insights to cut cost and lift utilisation, with one login and one source of truth.
Trusted by leading Australian fleets


Review Ctrack fleet analytics in a personalised demo to see your KPIs, scheduled reports and dashboards on one Crystal platform.
GPS tracking tells you where a vehicle was. Fleet analytics tells you what it cost, how hard it worked and what to do next. Ctrack takes the telematics your fleet already generates, location, CAN-bus engine data, driver behaviour and compliance records, and turns it into KPIs, trends and reports on one Crystal platform.
The result is the difference between a live map and management intelligence. Instead of exporting raw data and rebuilding it by hand, fleet managers get utilisation, fuel, idle and cost figures already calculated, so you can make informed decisions in minutes rather than days. Half of large Australian fleets already run telematics (AfMA / ACA Research, industry benchmark); the gap now is turning that data into board-level reporting, not collecting it.
Your vehicles produce location, engine and behaviour signals every day, but raw fleet data sitting across separate tools is not insight. Without one place to read it, the picture stays fragmented and the work falls to whoever can spare an afternoon for the spreadsheet.
Location logs, engine diagnostics and event timestamps pile up, but nothing turns them into a trend or a cost driver. The fleet data is there; the answer is not.
Someone exports the data, stitches a spreadsheet together and builds the charts before every meeting. It is hours of effort that adds no operational value.
The report shows what happened last month, not what to fix this week. You need outliers and baselines surfaced in time to act, not a record of cost you have already paid.
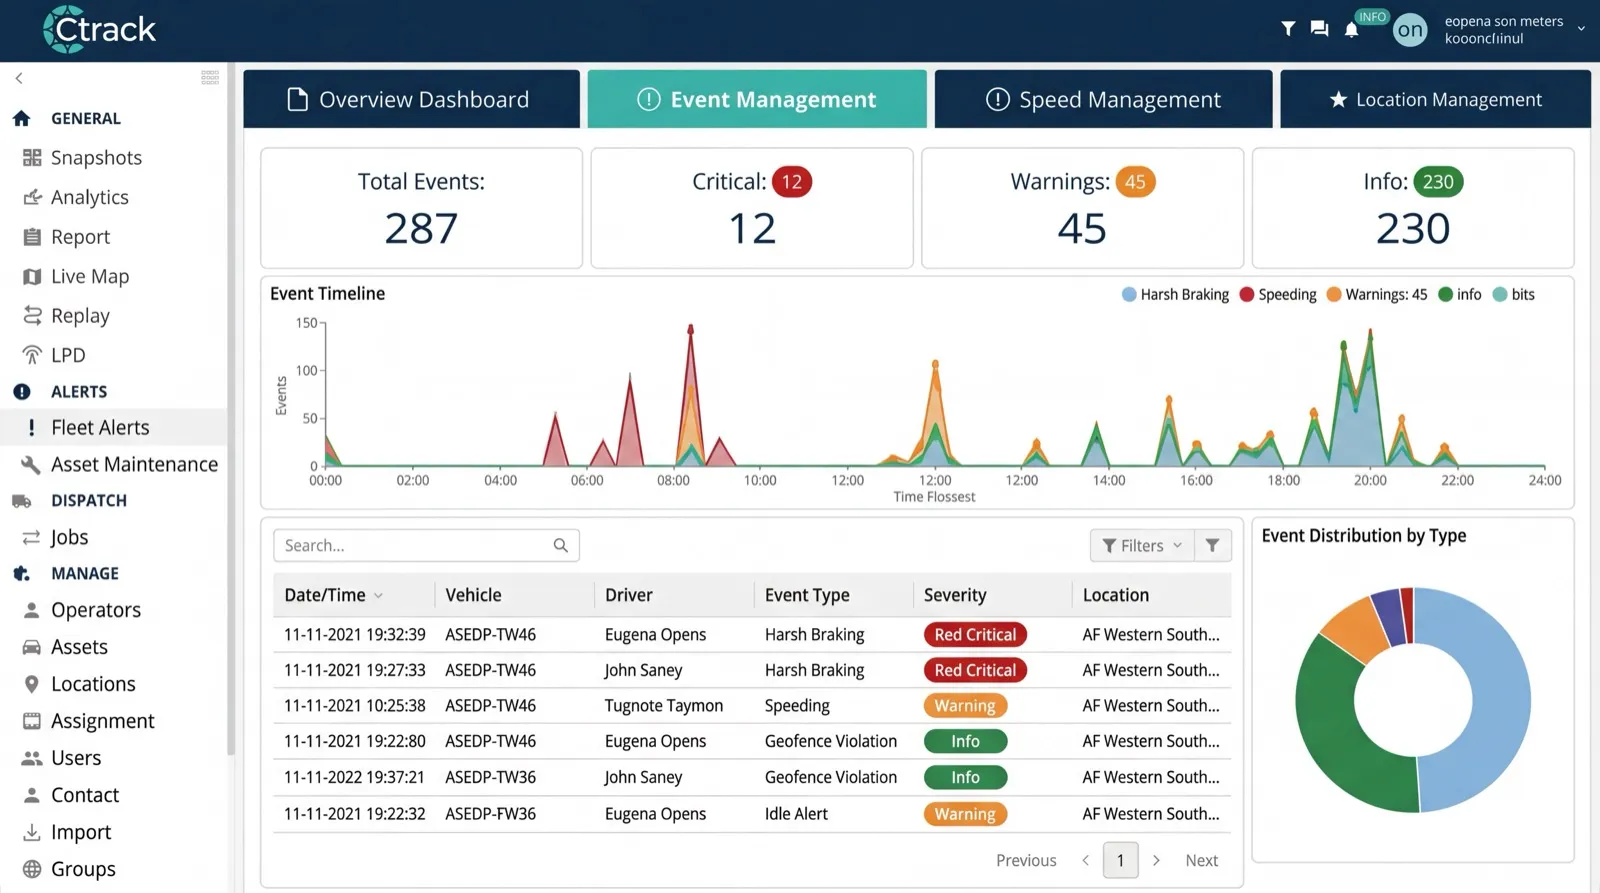
Fleet reporting on the Crystal platform turns raw telematics into output a leadership team can use, without rebuilding spreadsheets by hand. Pick the metrics that matter, set a daily, weekly or monthly schedule, and the reports generate on their own and land in stakeholders' inboxes as a finished PDF.
Pre-built KPI dashboards sit alongside utilisation, idle, fuel and exception reports, with around 30 package reports covering trip, odometer, working-hours and unauthorised-stop detail. Push the same data straight into Power BI, Tableau or Qlik, so fleet management reporting feeds the wider organisation rather than living in a silo. The licensed Crystal Analytics module adds scheduled KPIs with csv and PDF export at the Ultimate tier.
Every vehicle feeds one dataset, and Crystal does the calculation so your team works from data-driven decisions, not guesswork. Offline buffering keeps recording in remote and regional coverage gaps, so the picture stays complete.
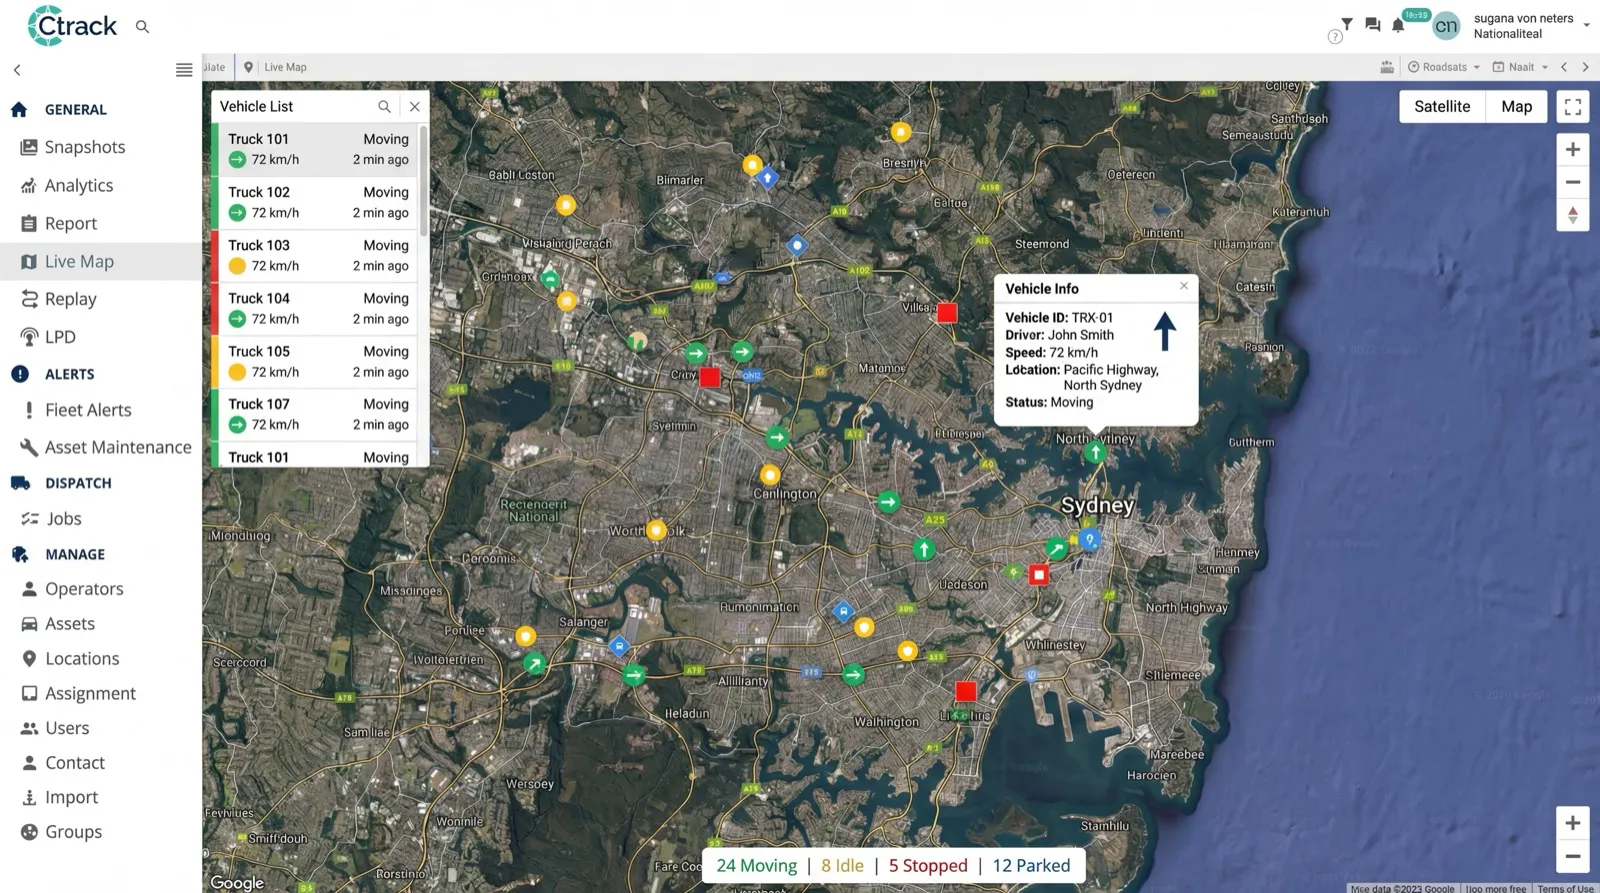
Fleet managers need more than pins on a map. Crystal reads cost per kilometre, fuel and idle, utilisation, maintenance-due signals and driver behaviour as the key performance indicators an operations team actually reviews, so you can optimise the fleet before small problems turn expensive.
Trend analysis benchmarks each metric against your own historical baseline, so you compare vehicles, drivers and depots on real numbers rather than a generic overseas average. Whether you run 10 vehicles or 1,000, the same KPIs read across cars, vans, trucks and plant on one platform.
Running cost broken down by vehicle, depot or period, so the expensive units are easy to spot.
Idle reporting exposes the fuel leak that non-productive idling drives, around 7% of fuel as an industry benchmark (EROAD Australia).
Active time versus idle time per vehicle, so underused assets you could redeploy stand out.
Behaviour scoring evidences performance in disputes, and fatigue is a factor in roughly 20% of heavy-vehicle crashes (NHVR, industry benchmark).
The cost of doing nothing is measurable, so frame your business case on the bleed that fleet analytics surfaces, then validate it against your own baseline before rollout. These are Australian industry benchmarks for the category, not a guaranteed Ctrack result, and the ROI calculator turns them into your numbers.
Cost of unplanned downtime per idle vehicle (AU industry benchmark). Maintenance-due analytics help you see it coming.
Non-productive idling burns around 7% of fuel (EROAD Australia). Fuel and idle dashboards expose where it hides.
Telematics evidence can support lower premiums (QBE Insurance, industry benchmark), with behaviour data backing the case.
Practical answers for fleet managers, operations teams and procurement professionals evaluating fleet management reporting.
Fleet analytics underpins the numbers behind your operation. Review the efficiency and cost levers that the data points to.
Turn the analytics into action on utilisation, idle and route waste, so every vehicle delivers measurable value.
Track fuel use and idling per vehicle, the single biggest controllable cost line for most fleets.
Site and zone alerts that feed exception reports, so unauthorised trips and after-hours use surface fast.
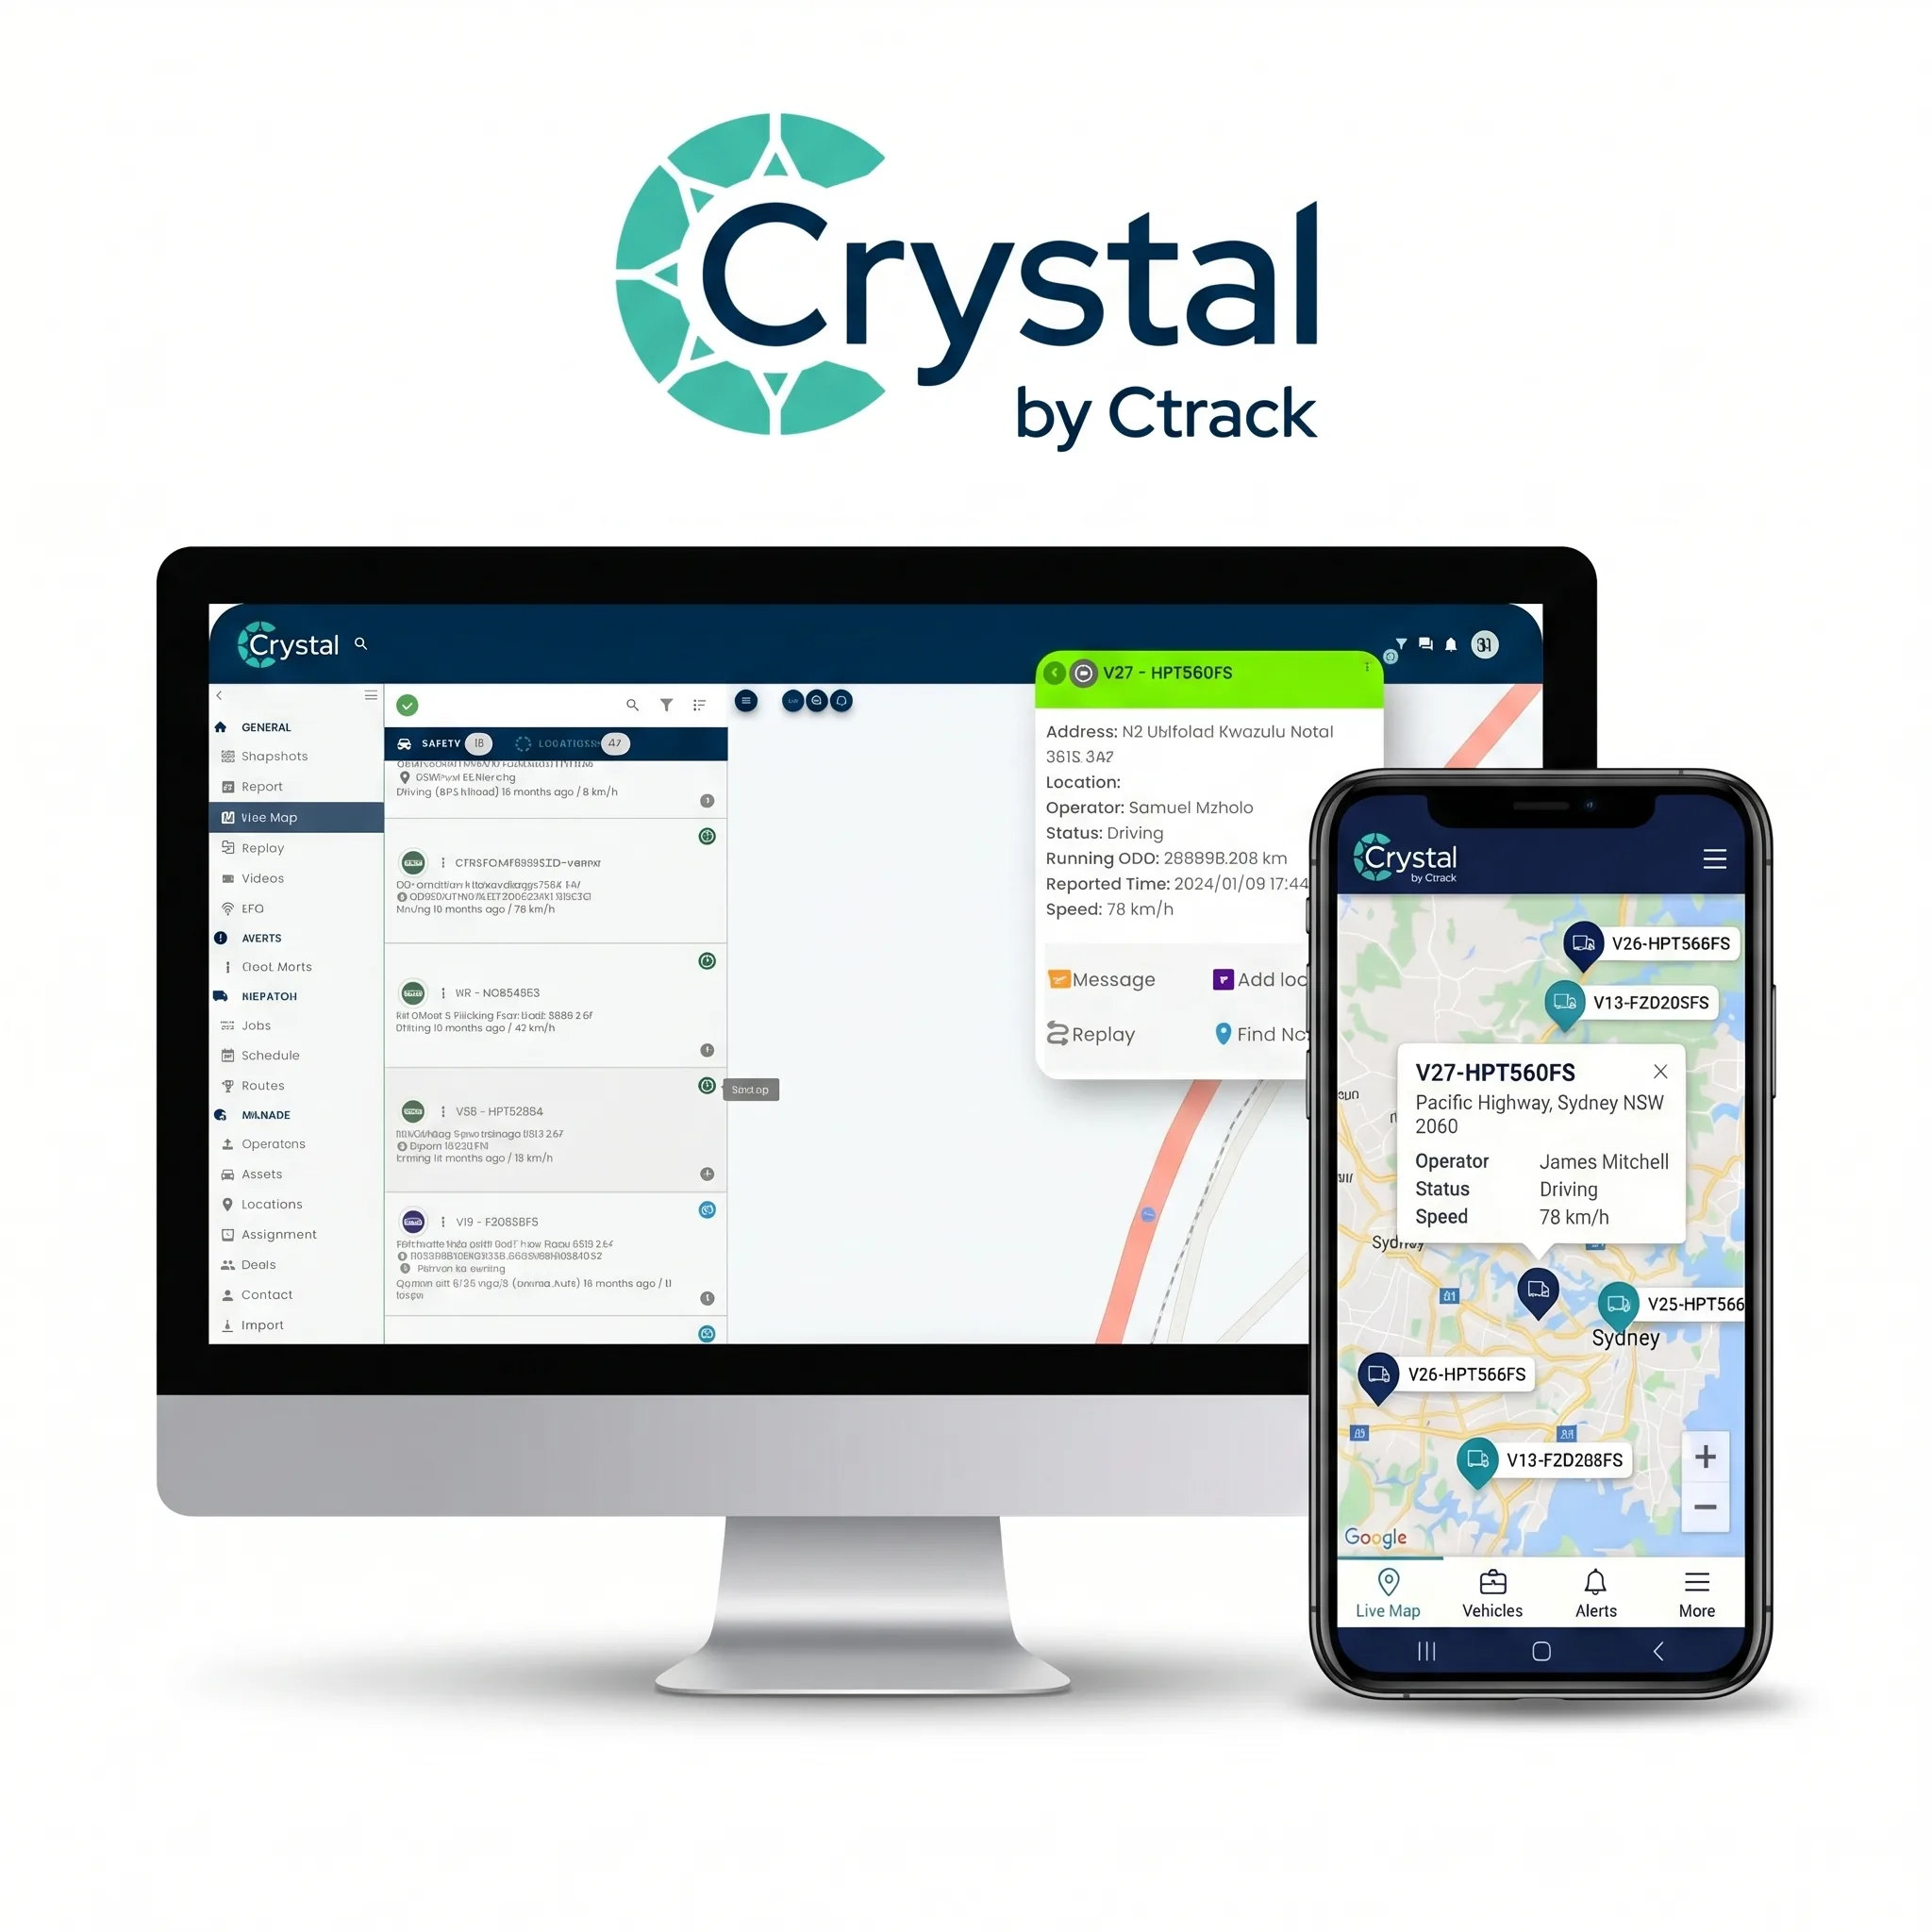
Part of the Ctrack platform
Fleet analytics runs on the same Crystal platform as the rest of your operation.
See your KPIs, scheduled reports and dashboards on one Crystal platform. Book a personalised demo and we will tailor it to your fleet.